October frosts stopped the season of fungal fruiting and now it is time to draw some conclusions. This post will be about our project on Fungal fruiting dynamics in ombrotrophic bog, that was started in Mukhrino in 2015. Now we have two years of observations on permanent plots located along the boardwalks.
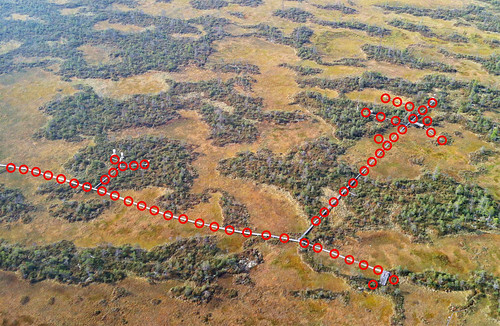
These circular plots were located along the boardwalk to prevent damage of the bog during regular visits. The plots markings are fixed on the boardwalk, and i am using a bent stick = compass to draw the borders of each plot (two semicircles by two sides of the walkway) and counting the fruitbodies inside the borders. The area of each plot is 5 m2, they are located about 5 m apart from each other, and total area of observation equals about 1400 m2 (277 plots). The habitats of treed bogs and open hallows are represented in equal proportion. It takes me near 5 hours to study the plots going from one plot to the next, counting bodies and collecting if necessary in collection, then removing them all to prevent recount next week. These observations were held once a week from the beginning to the end of vegetation season (May-October).
When someone asks me, what i am doing with my compass drawing semicircles on the bog surface, and i don’t want to give a straight answer, i say that i am showing them (fungi) where to grow :).

Equally 14 visits were made during seasons 2015 and 2016. From the environmental parameters, temperature of air, soil (peat), and precipitation were measured in the site. And there are several other parameters measured by the Mukhrino meteo-station, which could be pulled into the analysis if necessary (radiation, soil heat flux, atmospheric pressure etc.). Thus, using the data about fruiting and weather parameters we could model the parameters of fungal fruiting in the bog.
The first analysis of fruiting dynamics in 2015 was made in our short descriptive paper and in an oral report and a presentation during the conference:
Presentation: On the phenology of larger fungi in raised bogs: first year permanent plots monitoring results (pdf).
An oral report: (pdf, in Russian)
Finally (as we have two years of observations) i hope we could use some statistics to study the relations between fruiting and weather parameters. However, two years is only small period compared to decades of observations (for example, in Sweden: Büntgen U., Kauserud H., Egli S. 2011 Linking climate variability to mushroom productivity and phenology).
Here are some quantitative results of fruiting — 2016 in the bog:
Total accumulated number of fruitbodies during vegetation season / 1000 m2 — 2452 (2015) and 3736 (2016)
Maximum yield month — August (1294, 2015) and September (3061, 2016)
End of fruiting season — 14 September (2015) and 27 September (2016)
Number of registered species — 52 (2015) and 50 (2016)
And some pictures and graphs below: