Collection outcome of the last field season

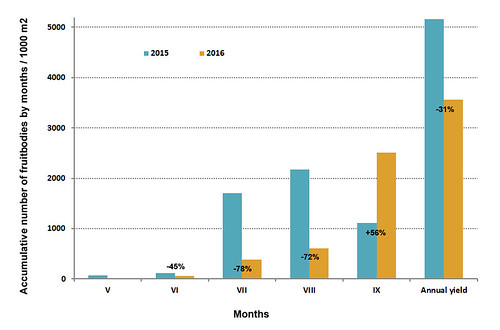
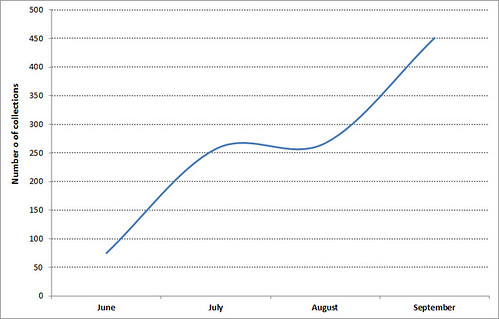
The collection of 2016 field season reached 1048 specimens! — having finished the import of collections metadata into Specify i have made some calculations and pictures. The beginning of the season was quite pure due to dry weather (75 specimens in June). An equal number of specimens was collected in July and August (257 and 267 spec.). And finally long-awaited rains in September made the baskets full (and 1050 collection specimens in fungarium drawers). It is strange and funny to see that my collection yield did not have an uniform curve, but oscillating between probably ..very inspired and slightly tired days.. 🙂

There was a few collection work in June, equally rich July & August and very busy September

A funny graph showing my oscillatory collecting effort

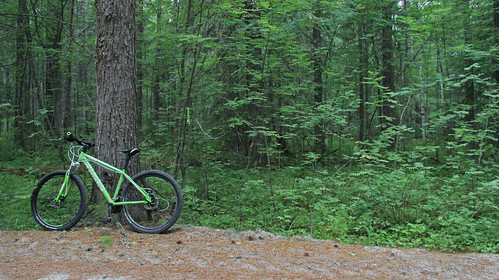
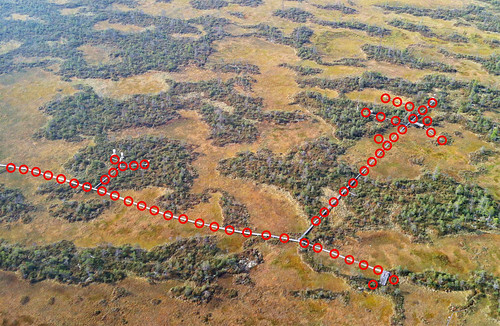
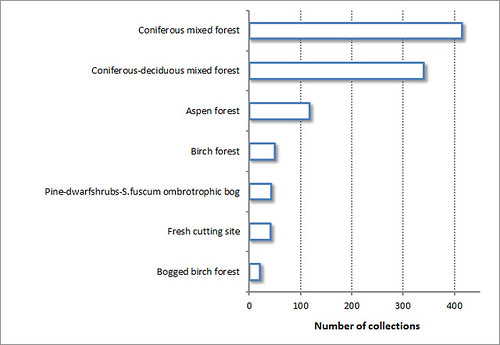
Relating to different vegetation types, the most of collections made from pure coniferous and coniferous with deciduous trees forests. About 10% of collections was made in predominantly Aspen forests and 5% in Birch forests. Collections from bogs, bogged forests and cutting sites made about 10% in sum.

Number of collections made in different vegetation types

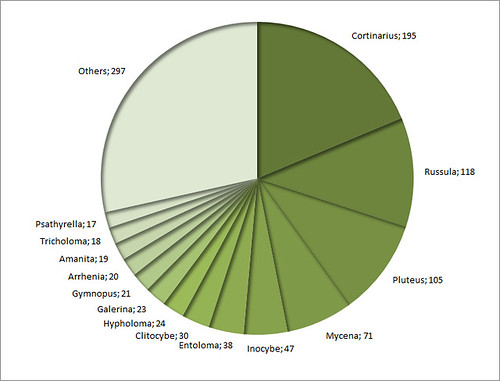
What do you expect about richness of Genera in this collection? — i would guess Cortinaria of course, Russula was quite abundant in mid-summer, also Mycena‘s, Clitocybe‘s, Entoloma‘s always collected since difficulties with in situ identification; plus surprisingly 105 specimens of Pluteus (luckily Tanya likes them).

Number of collections by Genera, leading are Cortinaria & Russulas:)

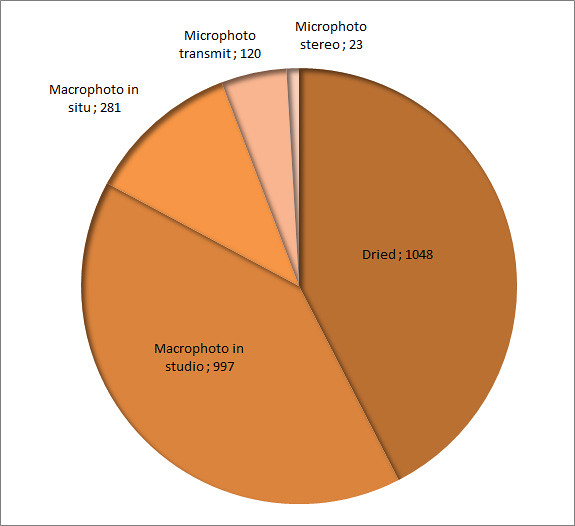
Here are some statistics about different preparations numbers: besides 1048 dried specimens, about 1000 macrophoto was made in studio, 280 photos made in situ. The last type of photographs is more time consuming but more valuable for different purposes. Some small fraction of collections was microscopied in fresh (vital) state and their pictures also stored in Specify.

The type and number of preparations made

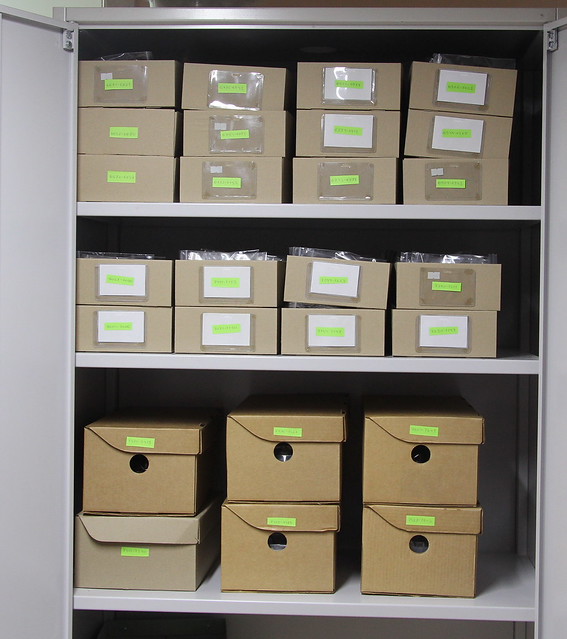
The total Fungarium collection reached about 4,5 thousands. The database in Specify online will be updated (going to pass it from my computer to server soon). And the fresh collection, currently sorted by numbers, should be rearranged by taxa and hopefully identified during this winter.

This season collection storage (sorted by collection numbers)

ShapDiv 2016 — first results

Finished field season, i am currently processing the field notes and transferring all data into the databases. Most of the past field season was devoted to studying communities of Larger fungi in vicinities of Shapsha village. We call this project Shapdiv (abbreviation of Shapsha diversity). It is the second year already spent working on the same 10 plots and thus some comparative analysis could be done between years. The methodology of work and first year results were described in detail in our going soon paper (Filippova, Bulyonkova, The diversity of larger fungi in the vicinities of Khanty-Mansiysk; under review currently).

10 plots were established in different types of forests corresponding to different stages of post-felling succession (plus one plot in bogged forest on peat). The plots were regularly visited during the season and all fungal bodies were collected and counted. Plot visits were supplemented by random walks in proximity to find rare species and habitats. Total collection of 2015 reached 1500 specimens and revealed large diversity of 463 species. We had not performed quantitative analysis and comparison of different communities based on 2015 season. There was not enough time to make this work, the next season come quickly, and now had passed. Thus, quantitative analysis will be done for two years at once.

There is still a lot of work with identification of collection-2016. But now i want to make the first sketch of the fruiting dynamics between two years and present in an album the photographs of the habitats. The weather conditions of two years (2015 and 2016) were very contrast: extremely wet and cold 2015 and dry and hot 2016. The substantial rains started only in the end of August-September in 2016 and the autumn was longer. The fruiting responded to these conditions very distinctly:

Abundance of fruiting by months and total annual yield.

I had not visited the plots in May in 2016 due to my absence in Khanty-Mansiysk (but fruiting in this month is very poor anyway). Following three months (June-August) in 2016 were very poor due to drought, fruiting decreased compared to 2015 by 45-78%. The rains started by the end of August triggered abundant fruiting in September (whilst in 2015 the first frosts in mid-September reduced the fruiting). Thereby, September in 2016 was twice more fruitful compared to 2015. Nevertheless, total abundance of wet 2015 year  was  larger by 30%.

Annual yields in different plots and vegetation types.

Interesting picture above shows comparison of total annual abundance between plots, with increase/decrease shown in %. It is the subject of future statistical analysis and discussions yet, but prior picture shows weak decrease in coniferous and larger decrease of fruiting in deciduous forest in 2016 compared to 2015. (only one plot in coniferous forest — Plot 2 — which is located on slope, has a larger decrease) Conversely,  the paludified (bogged) forest fruited more during the dry season of 2016. Perhaps it’s not a new discovery, as i found this in an old Mushroom guide:

Закономерно, что плодоносящие грибницы в сухие годы смещаются на более влажные участки, во влажные годы — в сухие места. (Практический справочник грибника. 1992г.)

.. 🙂 but still interesting to see these pictures.

And below is the album where i started to collect the photographs of habitats where the study is performed. This could be an important supplement to the data published in our paper and for future publications:

My transport to visit the plots, which are located between 1 and 5 km from the village.

Fruiting in the bog results 2016

October frosts stopped the season of fungal fruiting and now it is time to draw some conclusions. This post will be about our project on Fungal fruiting dynamics in ombrotrophic bog, that was started in Mukhrino in 2015. Now we have two years of observations on permanent plots located along the boardwalks.

These circular plots were located along the boardwalk to prevent damage of the bog during regular visits. The plots markings are fixed on the boardwalk, and i am using a bent stick = compass to draw the borders of each plot (two semicircles by two sides of the walkway) and counting the fruitbodies inside the borders. The area of each plot is 5 m2, they are located about 5 m apart from each other, and total area of observation equals about 1400 m2 (277 plots). The habitats of treed bogs and open hallows are represented in equal proportion. It takes me near 5 hours to study the plots going from one plot to the next, counting bodies and collecting if necessary in collection, then removing them all to prevent recount next week. These observations were held once a week from the beginning to the end of vegetation season (May-October).

When someone asks me, what i am doing with my compass drawing semicircles on the bog surface, and i don’t want to give a straight answer, i say that i am showing them (fungi) where to grow :).

A plastic compas is used to draw the plots borders

Equally 14 visits were made during seasons 2015 and 2016. From the environmental parameters, temperature of air, soil (peat), and precipitation were measured in the site. And there are several other parameters measured by the Mukhrino meteo-station, which could be pulled into the analysis if necessary (radiation, soil heat flux, atmospheric pressure etc.). Thus, using the data about fruiting and weather parameters we could model the parameters of fungal fruiting in the bog.

The first analysis of fruiting dynamics in 2015 was made in our short descriptive paper and in an oral report and a presentation during the conference:
Presentation:  On the phenology of larger fungi in raised bogs: first year permanent plots monitoring results (pdf).
An oral report: (pdf, in Russian)

Finally (as we have two years of observations) i hope we could use some statistics to study the relations between fruiting and weather parameters. However, two years is only small period compared to decades of observations (for example, in Sweden: Büntgen U., Kauserud H., Egli S. 2011 Linking climate variability to mushroom productivity and phenology).

Here are some quantitative results of fruiting — 2016 in the bog:
Total accumulated number of fruitbodies during vegetation season / 1000 m2 — 2452 (2015) and 3736 (2016)
Maximum yield month — August (1294, 2015) and September (3061, 2016)
End of fruiting season — 14 September (2015) and 27 September (2016)
Number of registered species — 52 (2015) and 50 (2016)

And some pictures and graphs below:

Plots location along the boardwalks, view from the air